![]()
![]()
Türker SahinI; Murat TezerII; Levent CeritIII
DOI: 10.21470/1678-9741-2018-0036
ANOVAs = Analyses of variance
CP = Completely punched
CPB = Cardiopulmonary bypass
ECMO = Extracorporeal membrane oxygenation
FVC = Femoral venous cannula
HVs = Hepatic veins
ID = Internal diameters
IVC = Inferior vena cava
LCIV = Left common iliac vein
LL = Luer lock
LRV = Left renal vein
LT = Liquid tank
MC = Measuring cup
MFVCs = Mock femoral venous cannula
MS = Multi-stage
Pd = Distal pressure
Pp = Proximal pressure
PVC = Polyvinyl chloride
R1 = Reservoir 1
R2 = Reservoir 2
RRV = Right renal vein
SS = Single-stage
TS = Two-stage
VAVD = Vacuum-assisted venous drainage
INTRODUCTION
In reoperative open heart surgeries, cardiac surgeons generally prefer both femoral artery and femoral vein cannulations for the safety of the operation and cardiac decompression before sternotomy[1]. Also, minimally invasive surgery, robotic surgery, and adult extracorporeal membrane oxygenation (ECMO) procedures[2] usually require femoral vein cannulation as well. Moreover, femoral vein cannulation may be preferred in emergency departments, catheterization laboratories, and even in thoracic cases such as lung transplantation[3]. However, when a femoral venous cannula is needed, venous blood drainage difficulty is a key challenge for both perfusionists and cardiac surgeons.
Hypovolemia, particularly in the venous system, creates a venous blood return problem. Even in the presence of sufficient circulatory blood volume, blood may not reach the pump if there is a venous collapse[4]. It is known that the quality of venous drainage can be affected by pre-load volume, after-load volume, and pump design[5], as well as the venous cannula's size and its design. Moreover, venous blood drainage can be affected by many reasons, such as the venous cannula's position, small sizes of vessel lumens, anatomic pathologies creating obstacles for vascular structures, massive air bloc in the venous cannula or in the tubing line, kink of the cannula or the tubing line, and obstruction of venous cannula's stages by vessels tissues or right atrial tissues, which mostly results from excessive negative pressure inside the venous tubing line[6]. All the above-cited reasons affect arterial blood flow and quality of perfusion. This situation obligates cardiac surgeons to insert a second venous cannula through the internal jugular vein or the axillary vein. However, some patients may, unfortunately, present with contraindications to a second venous cannula insertion from the upper site caused by a large goitre or severe neck arthrosis problems[7]. Therefore, a more effective femoral venous cannula is required to decrease the problems mentioned above.
The aim of this study is to find out what features should be found on femoral venous cannulas in order to provide a better drainage. In the literature, we couldn't find any experimental study including artificial venous circulation design with renal, mesenteric, and hepatic veins (HVs) lines. To perform the drainage tests under this experimental venous circulation design, we utilised four mock femoral venous cannulas (MFVCs), having different stages and different numbers of holes on the polyvinyl chloride (PVC) tube, and we performed the experiment. After some measurements and comparisons, we found that more holes on the venous cannula resulted in better venous drainage.
METHODS
Mock Cannulas
There are various femoral venous cannulas available on the market today. All of them have different diameters, lengths, stages, shapes, and numbers of holes. In order to create equal conditions for the test, real cannulas were not used. To realise this condition, four different MFVCs simulating femoral venous cannulas were designed. These mock cannulas were made from PVC tube lines (RAUMEDIC-ECC) with 1/4” inner diameter and 1/16” lumen thickness. The lengths of these mock cannulas were kept the same at 68 cm. To compare the effectiveness of the number of holes, a 5 mm aortic punch was used in order to get a standardised hole diameter on the PVC tube. As indicated in Figure 1, four MFVCs were used to test and compare the performance of the different number of holes on them. These MFVCs are: model A, simulates a single-stage (SS) cannula; model B, simulates a two-stage (TS) cannula; model C, simulates a multi-stage (MS) cannula; and model D, simulates a new designed mock cannula as completely punched (CP). The SS model has no extra hole on the PVC tubing line. The TS model has six holes on the PVC line: three on the proximal tip and three 15 cm from the proximal tip of the model. The MS model has a 15 cm punched area. There are 33 holes on the proximal side of the PVC line.


The number of holes or drainage surface area is particularly significant for this study. Therefore, the last MFVC model has a 50 cm punched area with holes on the PVC line. Because of the large number of holes throughout this line, it is called a CP model. The main difference of the CP model compared with other MFVC models is that it has basically more holes on the PVC line (Figure 1).
Mock Circulation
In order to compare four different MFVCs, a test circuit model was assembled, as shown in Figure 2. Various cardiopulmonary bypass (CPB) equipments and assemblies were used, including two hard-shell reservoirs, a roller pump, a digital touch screen monitor, pressure transducers (Zyron disposable blood pressure transducer set, Point Medikal, Ankara, Turkey), reusable transducer plates (Logical®, Medex), two pressure lines (150 cm), six 1/2”x1/2” luer lock (LL) connectors, four 3/8”x3/8” LL connectors, two 3/8”x1/2” connectors, a 3/8”x3/8”x3/8” Y-connector, a tubing clamp, a liquid tank (LT), a plastic clamp band, and PVC tubes in different internal diameters (ID), such as 1/8”, 1/4”, 3/8”, and 1/2”.


Two reservoirs were positioned at the height of 75 cm and before each measurement they were filled with 2,500 mL of gelofusine solution by using 3/8” PVC lines and a roller pump (Figure 2). Reservoir 1 (R1) volume represented superior vena cava and right atrial volume. Reservoir 2 (R2) volume represented inferior vena cava (IVC) and abdominal region venous volume. The reservoirs' outlet connectors were connected by a 3/8” (ID) PVC line (50 cm) and both 3/8” PVC lines were also connected to a 1/2” PVC tubing line imitating the IVC. In order to imitate IVC well, four 1/8” PVC lines were also connected to this 1/2” PVC line. These lines, from proximal to distal, simulated HVs, right renal vein (RRV), left renal vein (LRV), and left common iliac vein (LCIV), respectively. This designed circuit was ended with a 1/2”x3/8” connector. This circuit mainly imitated the IVC's blood flow, but it also imitated the blood volume and flow of the superior vena cava and right atrium.
Application
To evaluate the MFVCs' hydrodynamic performance, the tests were performed in a laboratory at 22oC room temperature, and gelofusine solution as a colloidal fluid was used in order to mimic the blood. The test circuit was completed with four MFVCs (SS, TS, 15 cm-MS, and CP), which were placed into the 1/2”x3/32” PVC line that was designed as the mock IVC. Initially, a SS mock cannula was inserted into the mock IVC. To provide priming, both reservoirs were filled with 2,500 mL of gelofusine solution withdrawn from LT by a roller pump. In order to create free gravitational force, the whole circuit and pressure lines were filled with gelofusine solution. Before test initiation, the roller pump was stopped and a tubing clamp was put on the distal tip of the mock cannula.
Pressure transducers were calibrated to “0” mmHg to ensure reliability. Whenever the tubing clamp was removed from the distal tip of this line, the countdown began at 60 seconds. The fluid in the reservoirs was drained into the measuring cup (MC) via the effect of gravity syphonic drainage. At the end of 60 seconds, the MFVC was clamped again.
Subsequently, the amount of this drained fluid was measured and recorded. After each measurement, the reservoirs were refilled up to 2,500 mL level. These measurements were repeated 34 times for each MFVC, and a total of 136 measurements were made during the entire experiment. During the drainage process, different pressures were obtained in both distal and proximal parts of the mock IVC. At the 5th second, both proximal and distal pressures of the mock IVC were recorded.
Statistical Analysis
Since the study used a within-subject design measuring four different dependent variables (SS, TS, MS, CP) and as the dependent variables had a normal distribution (P>0.05) according to the Kolmogorov-Smirnov test, then one-way repeated measures analyses of variance (ANOVAs) from parametric tests were performed to determine statistical differences among the groups. Also, from the post-hoc tests, Bonferroni tests were executed to compare the drainage flow of the four different variables for the experiment, which was repeated 34 times (n=34). A one-way repeated measures ANOVA revealed a significant difference among the four different variables for the drained fluid flow; F(3,99)=8725.22, P<0.01. Subsequently, a one-way repeated measures ANOVA revealed a significant difference among the four different variables for distal pressure (Pd); F(3,99)= 9247.20, P<0.01. Also, a one-way repeated measures ANOVA revealed a significant difference among the four different variables for proximal pressure (Pp); F(3,99)= 180.38, P<0.05.
RESULTS
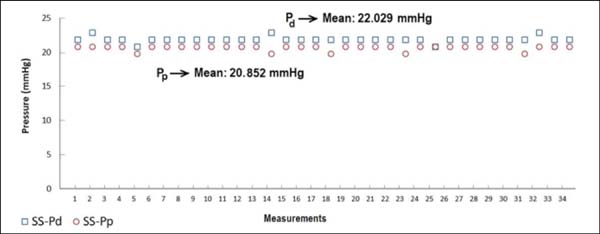
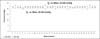
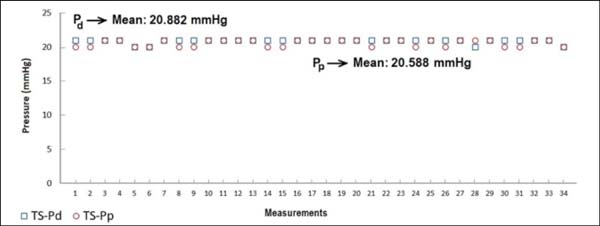
The data obtained from the measurements of flow amounts and pressures provide evidence to support the argument that, as the number of holes increases, the pressure markedly decreases, particularly on the proximal side. Thus, the drained volume of gelofusine increased significantly. According to the measurement results, the flow volume of the TS venous cannula was higher than that of the SS venous cannula. As expected, the volume performance of the MS venous cannula was better than those of the SS and TS cannulas. However, better drainage performances were obtained with the CP venous cannula. Figures 3 to 6 indicate pressures obtained from both distal and proximal sides of SS, TS, MS, and CP MFVCs, respectively.
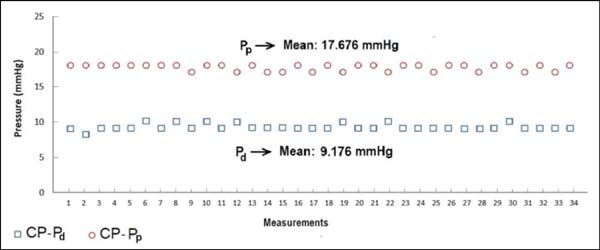
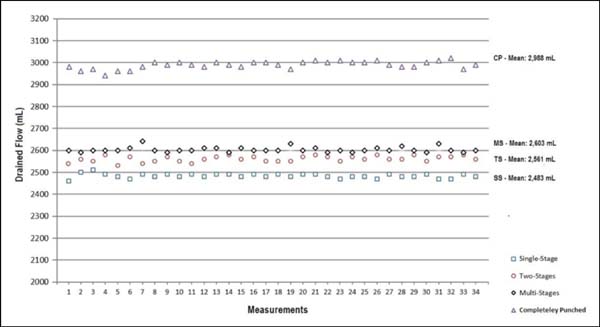
According to Figures 3 to 6, while the highest Pd were measured on SS MFVC, the lowest Pd were obtained from CP MFVC. The mean pressures of the distal sides of SS, TS, MS, and CP MFVCs were 22.029 mmHg, 20.882 mmHg, 19.029 mmHg, and 9.176 mmHg, respectively. On the other hand, the highest Pp were obtained from SS MFVC, while the lowest Pp were obtained from CP MFVC. The mean pressures of the proximal sides of SS, TS, MS, and CP MFVCs were 20.852 mmHg, 20.588 mmHg, 20.059 mmHg, and 17.676 mmHg, respectively. The tests revealed that there was a statistically significant difference among the mean pressures of the proximal side of each MFVC. The results demonstrate that, as the number of holes on the MFVCs increases, both the Pp and Pd of the cannulas decrease contrarily. Pressure differences of the MFVCs resulted in different flow amounts provided by gravitation. Figure 7 indicates the differences among flow amounts of these four MFVCs. According to Figure 7, while the lowest flows were obtained from SS MFVC, the highest flows were obtained from CP MFVC. The tests revealed that there was a statistically significant difference among the mean flow amounts of each MFVC. The mean flow amounts of the MFVCs reveal that, as the number of holes increases, the flow volume increases linearly. In summary, both distal and proximal mean pressures of the four variables decreased as the number of holes on MFVCs increased.
One-way repeated measures ANOVAs indicate that the mean flow drainage is 2,483.23 mL, 2,561.17 mL, 2,603.23 mL, and 2,988.52 mL for the four dependent variables SS, TS, MS, and CP MFVCs, respectively (Table 1). The result of the Bonferroni test shows that, as the number of holes increases, the amount of drained fluid by gravitation rises significantly. On the other hand, it can be observed in Table 1 that, as the number of holes or the drainage surface area increased, the mean Pd of the MFVCs significantly decreased from 22.02 mmHg (SS model) to 9.17 mmHg (CP model). Similarly, as the number of holes increased, the mean Pp of the MFVCs significantly decreased from 20.85 mmHg (SS model) to 17.67 mmHg (CP model).
| Mock Cannulas | Mean Pd (mmHg) | SD* | Mean Pp (mmHg) | Mean Flow (mL)SD* | SD* |
|---|---|---|---|---|---|
| SS (1 hole) | 22.02 | 0.38 | 20.85 | 2483.23 | 9.76 |
| TS (6 holes) | 20.88 | 0.32 | 20.58 | 2561.17 | 13.65 |
| MS (33 holes) | 19.02 | 0.17 | 20.05 | 2603.23 | 11.99 |
| CP (258 holes) | 9.17 | 0.45 | 17.67 | 2988.52 | 17.77 |
* SD=standard deviation.

DISCUSSION
Venous cannula drainage improves with a high number of inlet holes[8]. We tried to design a CP MFVC having more holes on it. In our study, we found that the CP MFVC model performed better for fluid drainage under the same test conditions than each mock cannula. Our study revealed that a greater drainage area (number of holes on the tube) is the key factor for a better fluid drainage amount.
In fact, the main reason behind the difficulties experienced with venous blood drainage is the smaller size of the femoral vein. In such situation, the vein's diameter is generally not suitable for insertion of a larger venous cannula for full perfusion. To overcome this problem and to achieve full perfusion flow during a CPB procedure, perfusionists generally must use a centrifugal pump on a venous line or use negative pressure (-20 to -40 mmHg), which is called vacuum-assisted venous drainage (VAVD). Unfortunately, these techniques create more complex connections and may increase complications during CPB. When applying higher negative pressure into the venous line[9,10], gas microembolus will increase. Also, assisted venous drainage may lead to air incoming to the venous bloodstream. Furthermore, the higher negative pressure in the venous line will create higher shear stress and haemolysis. To avoid such complications and to prevent vein collapse, additional monitoring is also required[11,12]. Under these conditions, the design of femoral venous cannulas is highly important.
The four different mock cannulas shown in Figure 7 were tested regarding the relationship between the number of holes on their tubing walls and the amount of fluid drainage. In fact, there were many factors affecting fluid drainage and creating handicaps during these tests, such as the position of the lines, position of the MFVCs that were inserted throughout the inside of the mock IVC, level of the distal tip of the MFVCs, starting or stopping fails on chronometry, fluid's viscosity, test room's temperature, etc. Obviously, all these variables may affect liquid dynamics and measurements of the fluid amount. Nonetheless, this test design simulating femoral venous cannula and human IVC provided the facility to measure and compare four MFVCs, not only regarding their Pd and Pp inside but also their provided amount of fluid.
In fact, the venous blood return towards to the right atrium is a result of the pressure difference between the mean circulatory filling pressure and the pressure in the right atrium. All these pressures and inner surfaces of the vessels create intravascular resistance against the blood flow, and they contribute to the creation of shear stress. In this experimental circuit, there was no such contrary pressure making resistance to the gelofusine solution in the tip of the MFVC. This peculiarity of the artificial circuit provided a very similar condition regarding venous blood drainage to the venous reservoir during open heart surgery.
Many factors, such as the diameters and shapes of the cannulas, connections and structures of the MFVCs, fluid's temperature, test room's viscosity, and velocity of the fluid used in the test circuit, are influential on shear stress. We estimate that all the above-cited factors affected the shear stress and the flow volumes drained by gravitation in the tubes. Thus, they all contributed to create different pressures in the distal and proximal sides of the MFVCs. These factors create shear stress differences among the MFVCs, consequently causing flow differences.
The possible venous blood contribution for the VCI blood flow mainly comes from the HV, RRV, LRV, LCIV and right common iliac vein. If a femoral venous cannula is inserted into the right femoral vein towards the right atrium, the cannula itself will form a barrier to the venous blood coming from iliac veins and renal veins. In order to simulate this scenario, four 1/8” PVC lines were connected to the mock IVC in the test circuit (Figure 2). Through this design, different drainage capabilities of four MFVCs were evaluated and compared. In conclusion, this study demonstrated that the CP MFVC provided better fluid drainage by free gravitation than the other MFVC models.
Limitations
In the clinical application, all the holes of the CP femoral venous cannula (FVC) must be inserted completely into the venous system, therefore different sizes of CP FVCs must be kept ready in the operating theatre and they must be selected according to the length of the patient.
This study may be criticised regarding its simulation efficiency and its fidelity of MFVC or mock IVC. In fact, our objective was not to achieve the perfect fidelity of the circulatory and vascular systems. The aim of this study was limited to created standard conditions for the MFVC tests. Yet, many more variations, such as other fluids (hetastarch 6%, plasma, and even whole blood with different hematocrit) in different rooms and fluid temperatures, precise chronometry usage, the fidelity of vascular response and flexibility, in vivo studies in animal laboratory, etc., may be considered throughout the test circuit design in future studies about drainage performance of CP MFVC.
CONCLUSION
When we compared the results, they suggested that the CP MFVC model provided better fluid drainage under the same test conditions than other MFVC models. While the CP MFVC shows a reduced pressure for distal and proximal sides of the cannula, it drained much more fluid. Our study may shed light on in vivo studies, which need to be addressed in the future. This novel cannula design aims to provide better and simply venous blood drainage from femoral vein.
REFERENCES
1. Merin O, Silberman S, Brauner R, Munk Y, Shapira N, Falkowski G, et al. Femoro-femoral bypass for repeat open-heart surgery. Perfusion. 1998;13(6):455-9.
2. Napp LC, Kühn C, Hoeper MM, Vogel-Claussen J, Haverich A, Schäfer A, et al. Cannulation strategies for percutaneous extracorporeal membrane oxygenation in adults. Clin Res Cardiol. 2016;105(4):283-96.
3. Riley W, FitzGerald D, Cohn L. Single, percutaneous, femoral venous cannulation for cardiopulmonary bypass. Perfusion. 2007;22(3):211-5.
4. Li L, Abdel-Sayed S, Berdajs D, Ferrari E, von Segesser LK. Venous cannula performance assessment in a realistic caval tree model. Interact Cardiovasc Thorac Surg. 2015;20(2):194-9.
5. Amoore JN, Santamore WP. Venous collapse and respiratory variability in systemic venous return. Cardiovasc Res. 1994;28(4):472-9.
6. Jegger D, Tevaearai HT, Mueller XM, Horisberger J, von Segesser LK. Limitations using vacuum-assist venous drainage technique during cardiopulmonary bypass procedures. J Extra Corpor Technol. 2003;35(3):207-11.
7. Sansone F, Flocco R, Punta G, Dato GMA, Parisi F, Zingarelli E, et al. Cardiopulmonary bypass using a single venous femoral cannula in minimally invasive combined mitral and tricuspid valve surgery using a right thoracotomy. NeSECC Online Journal. 2012;1-3.
8. Simons AP, Ganushchak Y, Wortel P, van der Nagel T, van der Veen FH, Jong DS, et al. Laboratory performance testing of venous cannulae during inlet obstruction. Artif Organs. 2008;32(7):566-71. [MedLine]
9. Jegger D, Tevaearai HT, Horisberger J, Mueller XM, Boone Y, Pierrel N, et al. Augmented venous return for minimally invasive open heart surgery with selective caval cannulation. Eur J Cardiothorac Surg. 1999;16(3):312-6. [MedLine]
10. Pozzi M, Henaine R, Grinberg D, Robin J, Saroul C, Delannoy B, et al. Total percutaneous femoral vessels cannulation for minimally invasive mitral valve surgery. Ann Cardiothorac Surg. 2013;2(6):739-43. [MedLine]
11. Davila RM, Rawles T, Mack MJ. Venoarterial air embolus: a complication of vacuum-assisted venous drainage. Ann Thorac Surg. 2001;71(4):1369-71. [MedLine]
12. De Somer F. Venous drainage: gravity or assisted? Perfusion. 2011;26(Suppl 1):15-9.
Authors’ roles & responsibilities
TS Conception and design of the work; acquisition of data; analysis and interpretation of data; drafting the paper; revising the work; approval of the final version
MT Analysis and interpretation of data; drafting the paper; revising the work; approval of the final version
LC Analysis and interpretation of data; drafting the paper; revising the work; approval of the final version
Article receive on Monday, February 12, 2018
 All scientific articles published at rbccv.org are licensed under a Creative Commons license


All rights reserved 2017 / © 2024 Brazilian Society of Cardiovascular Surgery
DEVELOPMENT BY ![]()


 Read in English
 English PDF
 Print
Print
 Send this article by email
 How to cite this article
 Submit a comment
 Mendeley
 Pocket